Franklin Project / East Texas
With our East Texas Projects, we have secured a significant brine lease position, drilled, and sampled lithium brine showing immense potential to develop a resource and future production.
A Preliminary Economic Assessment has been prepared for the Franklin Project, the JV’s first project in the East Texas region of the Smackover. It highlights the size and quality of the asset, with some of the highest reported lithium-in-brine grades in North America.
The JV is targeting potential production of over 100,000 tonnes of lithium chemical production per year in Texas through multiple phases and projects.
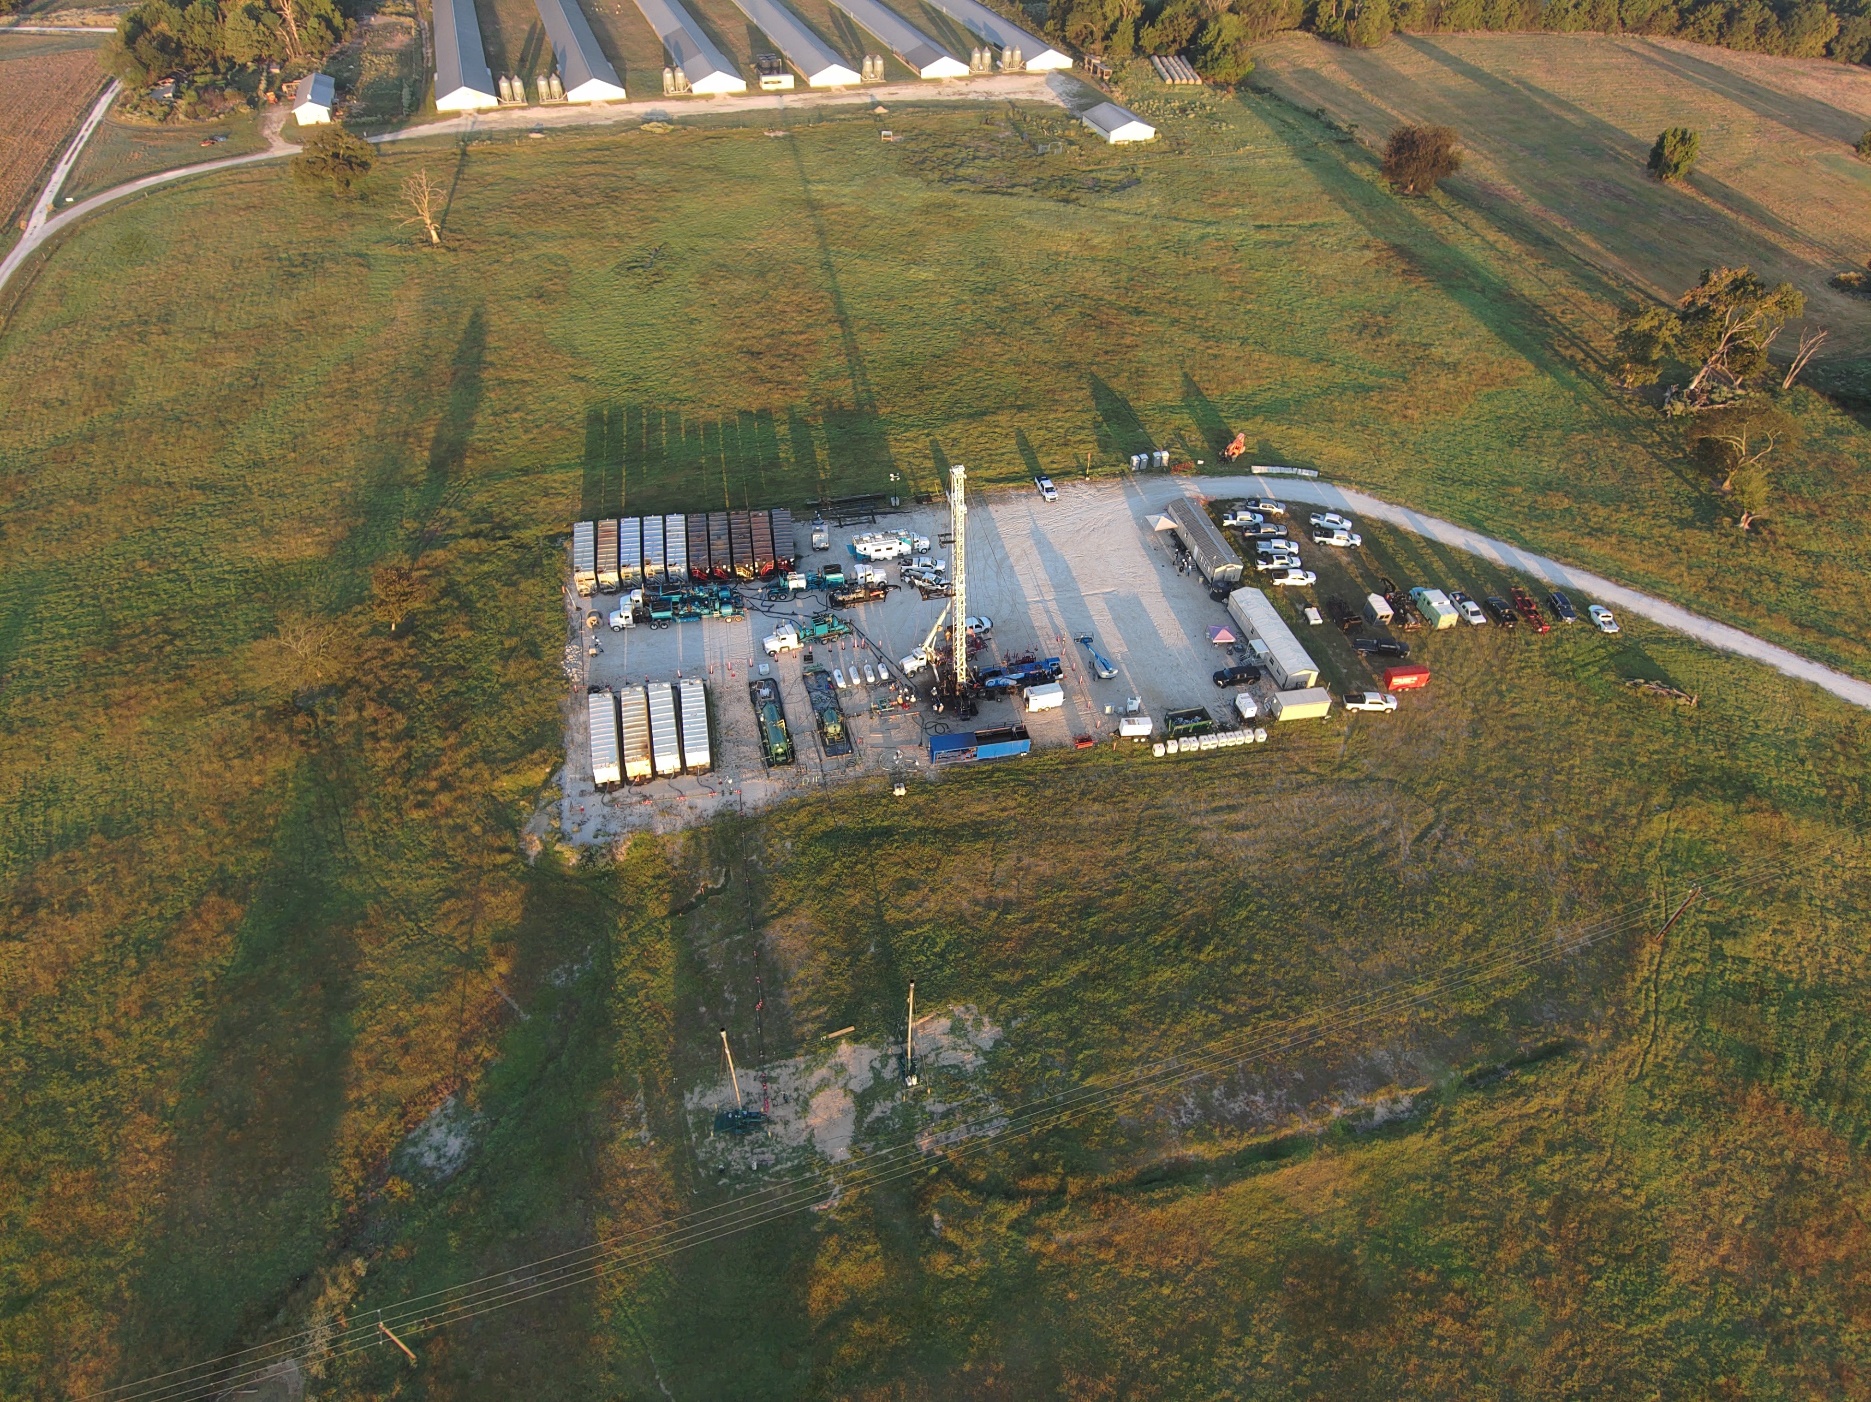
* Lundell Creek site within Franklin Project
Franklin Project Preliminary Economic Assessment Highlights
- Robust lithium project economics. Unlevered pre-tax NPV8 of $5.9 billion, an IRR of 25.7%, and a 3-year payback, assuming a lithium carbonate price of $22,400 per tonne
- Globally significant production scale. Annual production capacity of up to 70,000 tonnes of battery-quality lithium carbonate over a 20-year modelled operating life, with an average lithium concentration of 515 mg/L. Initial production could begin in the early 2030’s with additional potential for a longer operating life and further expansion
- Competitive operating cost estimate. Average annual lithium cash operating costs of $4,226/t projected over the operating life, and average annual all-in costs, inclusive of cash operating cost, royalties, sustaining capital and closure costs, of $5,054/t
- Capital requirements. Lithium initial capital cost estimate of $3.5 billion, including contingencies of 20%, resulting in a capital intensity of $49,945/t
- Increased exploration activities support significantly larger and upgraded Mineral Resource definition. Increased lithium and bromine Mineral Resource size and a portion of the Mineral Resource converted from Inferred to Indicated as compared to the Maiden Inferred Resource Report. There also remains an Inferred potash (as potassium chloride) Mineral Resource
- Extensive brine mineral leasing for the Franklin Project. Brine mineral leasing has been ongoing since 2022 in the project area now encompassing 44,541 hectares (110,064 acres), an increase of 37% from the Maiden Inferred Resource Report. A total 30,994 hectares (76,588 acres) gross mineral area has been leased to support the Mineral Resource
- Additional value creation potential from bromine. The PEA considers a scenario based on co-located bromine commercial opportunity of 50,000 tonnes per year
- Possible future upside from potash. The PEA does not assume any potash recovery, production or economic contribution, but does highlight another possible source of future upside subject to technical, economic and market evaluation
| Lithium Facility and Wellfield [1] | ||
| Annual Production Capacity of Lithium Carbonate | tpa [2] | 70,000 |
| Average Production over Modelled Plant Operating Life | tpa [2] | 64,600 |
| Modelled Plant Operating Life | years | 20 |
| Average Brine Flowrate over Modelled Plant Operating Life | bbl/d [3] | 455,000 |
| Lithium Concentration at Start of Production (Year 1) | mg/L | 562 |
| Average Lithium Concentration over Plant Operating Life | mg/L | 515 |
| Initial CAPEX | $ million | 3,496 [4] |
| Capital Intensity | $’000/t | 49.9 [5] |
| Average Annual Cash Operating Cost | $/t | 4,226 |
| Average Annual All-in Cost | $/t | 5,054 [6,7] |
| Lithium Carbonate Selling Price | $/t | 22,400 [8] |
| Discount Rate | % | 8 |
| NPV (Pre-Tax) | $ million | 5,924 |
| NPV (After-Tax) | $ million | 4,992 [9] |
| IRR (Pre-Tax) | % | 25.7 |
| IRR (After-Tax) | % | 24.0 [9] |
| Payback Period (Pre-Tax) | years | 3.0 |
| Payback Period (After-Tax) | years | 3.1 [9] |
Notes:
No bromine or potash is considered in this economic case. Any discrepancies in the totals are due to rounding. No inflation or escalation factor has been applied for the economic modelling
[1] The PEA is preliminary in nature and includes Inferred Mineral Resources that are considered too speculative to have the economic considerations applied to them that would enable them to be categorized as Mineral Reserves and there is no certainty that the PEA will be realized.
[2] tpa denotes tonnes (1,000 kg) per annum.
[3] bbl/d denotes barrels per day. 1 cubic metre per hour = 151 barrels per day.
[4] Initial capital expenditures include 20% contingency.
[5] Calculated as initial CAPEX divided by annual production capacity of lithium carbonate.
[6] Non-GAAP financial measure that includes cash operating cost, royalties, sustaining capital and closure costs.
[7] Royalties include gross revenue lithium royalty of 2.5%. Lithium royalties in Texas are established on a lease-by-lease basis and are agreed between the lessor and lessee. The exact royalties signed by Smackover Lithium are confidential and commercially sensitive, but 2.5% is used in the project economics as a representative rate suitable for the purposes of the PEA.
[8] Selling price of battery-quality lithium carbonate based on a flat assumed price of $22,400/t over total Project lifetime.
[9] Illustrative after-tax calculations based on assumption that the Project corporate entity is taxed as a stand-alone US C-Corporation and does not include the potential impact of currently held corporate net operating losses or credits, nor potential tax shields generated from financing. Assumes a U.S. Federal income tax rate of 21% and a State of Texas franchise tax rate of 0.59% (net of federal benefit).
Franklin Project Mineral Resource Estimates [1,2,3,4,6,7]
| Resource Category | Units | Indicated | Inferred | Inferred | Inferred |
| Smackover Formation | Upper Smackover | Upper Smackover | Middle Smackover | Total Smackover | |
| Gross Aquifer Volume | km3 | 7.84 | 8.70 | 17.16 | 25.86 |
| Net Aquifer Volume | km3 | 3.25 | 3.31 | 0.83 | 4.15 |
| Avg. Porosity | % | 18.21% | 17.95% | 12.6% | 16.86% |
| Brine Volume | km3 | 0.59 | 0.59 | 0.10 | 0.70 |
| Avg. Lithium Concentration | mg/L | 562 | 562 | 626 | 572 |
| Contained Lithium | kt | 333 | 334 | 66 | 400 |
| LCE [5] | kt | 1,771 | 1,779 | 349 | 2,128 |
| Avg. Bromide Concentration | mg/L | 4,483 | 4,483 | 4,600 | 4,501 |
| Contained Bromide | kt | 2,655 | 2,666 | 482 | 3,148 |
| Avg. Potassium Concentration | mg/L | NA [8] | 11,096 | 12,400 | 11,291 |
| Contained Potassium | kt | NA [8] | 6,597 | 1,299 | 7,896 |
| Contained Potassium Chloride (Potash) [5] | kt | NA [8] | 12,579 | 2,477 | 15,056 |
Notes:
Numbers may not sum due to rounding.
[1] The effective date of the Mineral Resource is July 20, 2026. The Qualified Person for the Mineral Resource is Randal Brush, P.E., an employee of Haas & Cobb Petroleum Consultants.
[2] Mineral Resources were prepared in accordance with 2019 CIM Estimation of Mineral Resources and Mineral Reserves Best Practice Guidelines, CIM Leading Practice Guidelines for Sedimentary Basin and Geothermal Brine-Hosted Lithium Mineral Resources and Mineral Reserves Estimation and are reported in accordance with CIM Definition Standards.
[3] Mineral Resources are not Mineral Reserves and do not have demonstrated economic viability. There is no certainty that all or any part of a Mineral Resource will ever be converted into a Mineral Reserve. The estimate of Mineral Resources may be materially affected by geology, environment, permitting, legal, title, taxation, socio-political, marketing, or other relevant issues.
[4] The Mineral Resource estimate is reported using a cutoff of 6.0% porosity (net aquifer) and 100 mg/L lithium using the following assumptions: brine extraction from production wells and direct lithium extraction processing technology, lithium carbonate price of $22,400/t, twenty-year operating costs of $5,461 million, brine production volume of 528 million m3, lithium process recovery of 89.25% and 2.5% royalty on gross revenue on lithium production.
[5] Lithium has been converted to LCE by a conversion factor of 5.323 and potassium has been converted to potash by a conversion factor of 1.91.
[6] The lithium, bromide, and potassium resources present in the Upper Smackover and Middle Smackover intervals were estimated based on the 30,994 hectare gross Smackover Lithium leased mineral area within the 44,541 hectare Project area.
[7] The mineral concentration values for the Upper Smackover interval are the average of the three exploration wells from samples collected in 2025/2026. The mineral concentration values for the Middle Smackover interval are the average sample values collected in 2023 from a single exploration well.
[8] Potassium Mineral Resources are limited to the Inferred category because the potassium recovery process still requires development. In addition, capital and operating cost studies have not yet been conducted that would permit evaluation of the economic viability of the deposit with regard to potassium. Therefore, there are no potassium Mineral Resource estimates associated with the Indicated Resource area of the Upper Smackover interval.
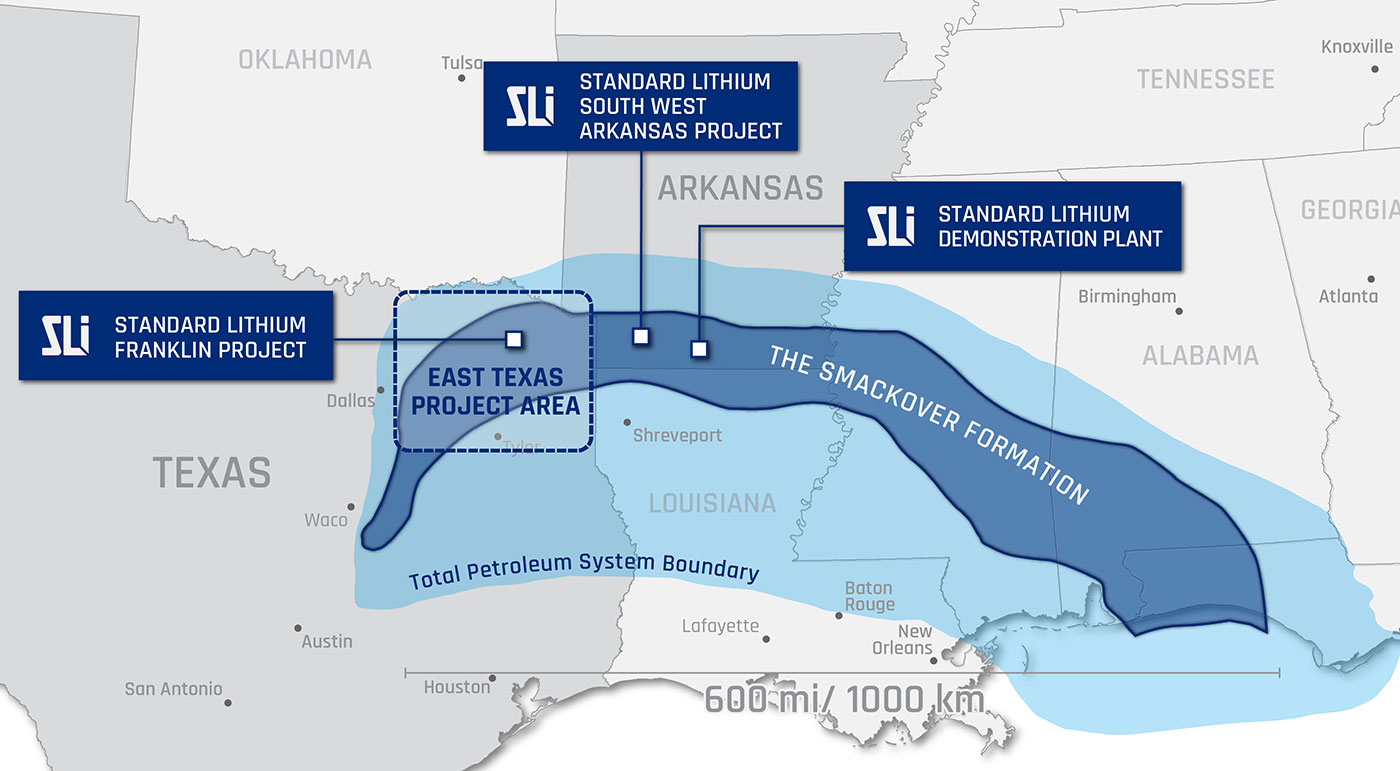
Franklin Project Area Map
Technical Reports
The Preliminary Economic Assessment Technical Report is currently being finalized. Please refer to the press release: